Supply and demand zones introduction ‑ page 1 What do you mean supply and demand
Page 1: What do you mean supply and demand
Page 2: Institutions vs retail: Wyckoff still works
Page 3: The 4 market stages: Inside the order flow
Fundamental market laws
"The fundamental forces of supply and demand..."
"Supply and demand imbalances at key price levels..."
Surely you have heard expressions like these and wondered what their authors actually meant, let alone how they intended to trade that supply or that demand. Or even if they actually traded it.
Let's cut to the chase: supply and demand are indeed inescapable forces in all markets. That is self-evident. However, the words are used in countless ways, and without precise definition they become almost meaningless.
Here we specifically discuss supply and demand in the form of hidden pockets of unfilled orders in certain price ranges. We call such price ranges Supply Zones when they are sell orders and Demand Zones when they are buy orders.
How these zones form, how to identify them on charts, and how to trade them, is the methodology of supply and demand zones trading.
While far from a full course, we will share the basics and the background here, including insights rarely shared anywhere else.
For existing supply/demand zones traders who may be struggling to reach consistent profitability, we'll discuss why even perfectly identified and perfectly drawn zones aren't necessarily great trades in the wrong context — and how to spot that before you trade them.
Let's get to it.
There is TA and there's TA
Most technical analysis centers round indicators based on moving averages, standard deviations etc, which employ math on a fixed series of price bars in an attempt to explain the past and predict the future.
While certainly not without their uses and legitimacy, such indicators have a tendency to be self-fulfilling: their signals are lagging by nature, and they often work only to the extent enough traders act on them, thus moving price "as predicted" by the indicators. But they often lack fundamental reasons for why price should react to them.
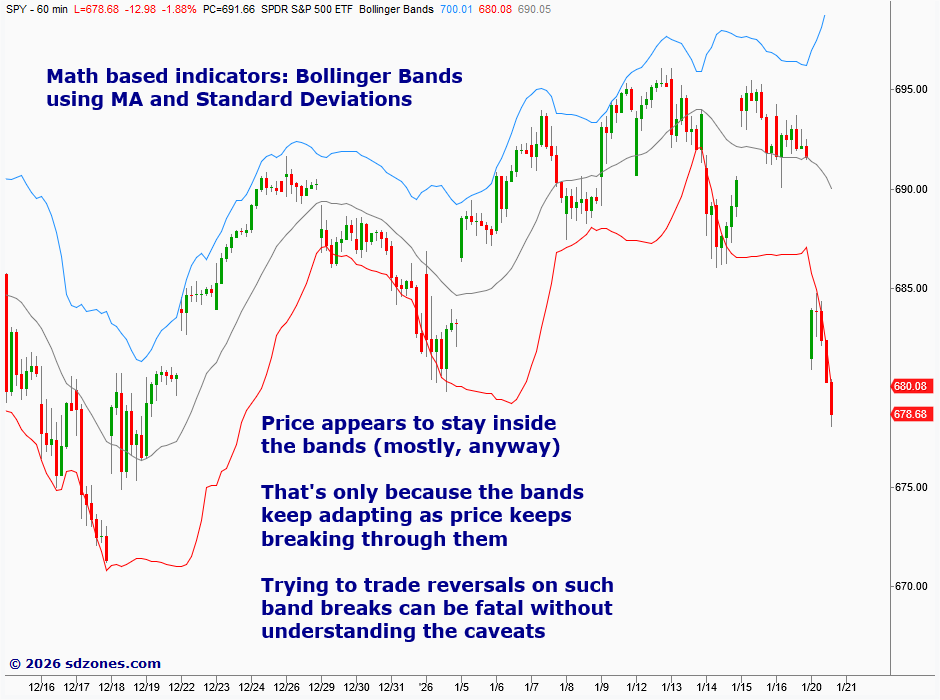
Based on a moving average and standard deviations, Bollinger Bands are incredibly popular. But they can be deceiving: a novice trader may see that price tends to stay within the bands, leading to the alluring idea that it reverses because of the bands.
The truth, of course, is the opposite: the bands are lagging and adapt to price, which is why price always appears to stay inside them. Even then, Bollinger Bands can be very useful given proper rules and understanding of price context. But they remain a good example of the self-fulfilling nature of many math-based indicators.
Supply/demand zones are different beasts, more akin to traditional support/resistance levels and various chart patterns. These kinds of TA cannot be calculated with straightforward math. They must be identified individually by analyzing historical price activity on charts.
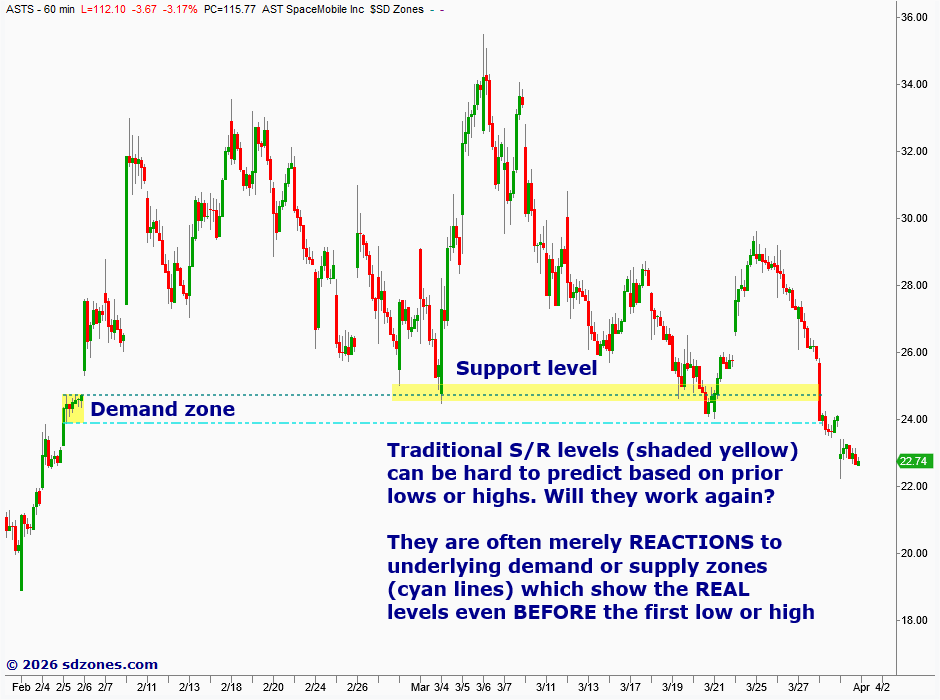
In the case of traditional S/R levels, traders simply look for prior highs and lows, betting that they will repeat themselves. Like other popular TA methods, S/R levels are somewhat self-fulfilling, and so prior highs and lows often do repeat themselves. Until they don't.
Whether traded as reversals or breakouts, traditional support and resistance levels can be subjective, and predicting their reliability can be hard, because they tend to be mere reactions to the underlying order flow. By identifying their true origin, often a supply or demand zone, we are looking at the source of the move rather than its echo.
Identifying supply/demand zones is significantly more involved than S/R levels, traditionally requiring a pair of human eyes and extensive (not to mention expensive) training and practice.
Our SD Zones indicator proves that identifying quality zones can be done by software, and with accuracy often outperforming trained eyes.
You can read more about SD Zones here, watch our latest training videos on YouTube, or download the full User Guide. But this article is an introduction to the supply/demand methodology, not about SD Zones. So let's move on.
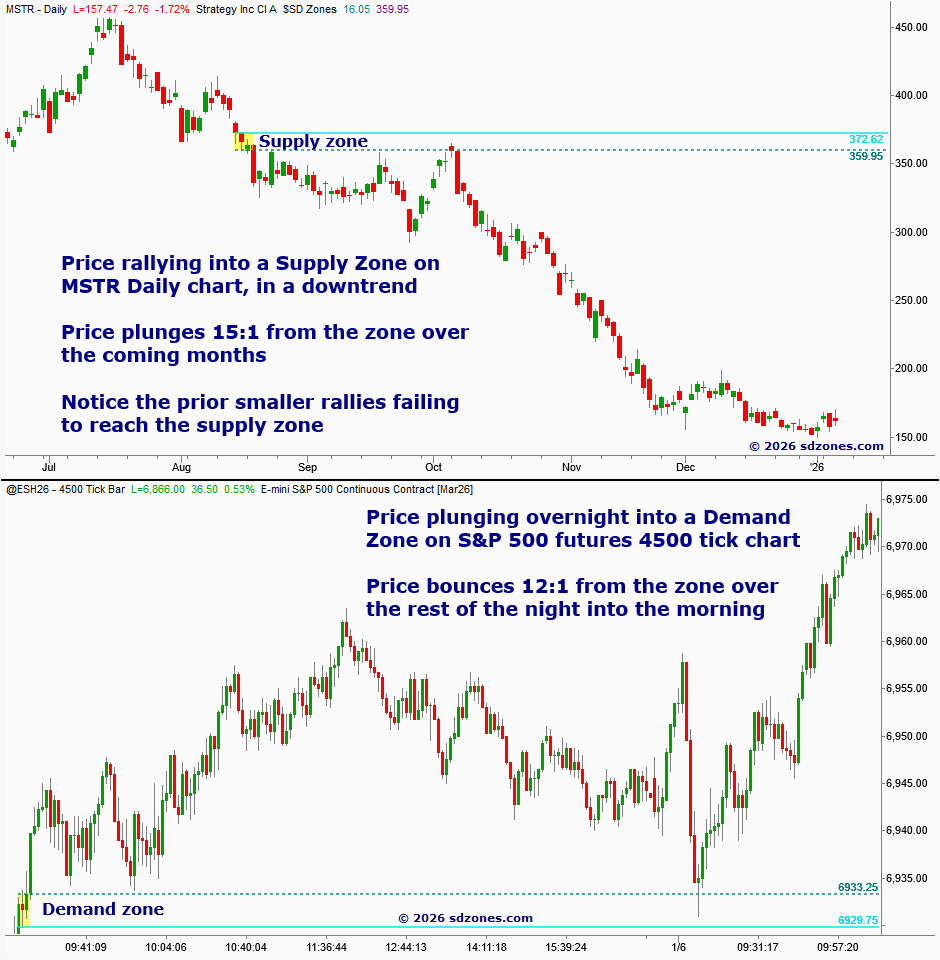
A supply zone on a Daily stock chart (top, each bar representing a full day's trading) and a demand zone on a futures tick chart (bottom, each bar representing a number of trades rather than a specific length of time). They both show price reversing after coming back to the zones ("revisiting" them).
This illustrates a key aspect of the supply/demand methodology: it works on any timeframe, including Weekly, Daily, Hourly, Minutes, Seconds, Tick or Volume charts; and it works in any market, including stocks, ETFs, futures, forex or crypto. It works phenomenally with options too when applied to charts of the underlying.
The number of "Master supply/demand trading in 60 seconds" videos which have surfaced on YouTube should tell you something about how NOT to do it: anything easy in trading quickly stops working once it becomes too crowded. That is, if it ever worked in the first place. It is a fundamental but painful truth that everybody cannot be winners when it comes to trading.
However, properly identified supply and demand zones have worked reliably for a century. And that's your clue right there.