Supply and demand zones for serious traders
Do you miss great supply/demand trades because you didn't happen to look at the right chart at the right time?
Have you used supply/demand indicators that gave you zones which didn't work half the time?
Do you see great reversals and wonder what caused them and how you might have caught those trades?
The SD Zones indicator adds one of the most reliable and time-tested technical analysis tools to your trader's arsenal: Supply Zones and Demand Zones reveal the price levels where banks, funds, institutions and other "whales" do their buying and selling.
It is a complete system comprising 10 different indicators and 20 ready-to-use workspaces for stocks, options, futures, forex and crypto trading, designed to solve the primary pain point of supply/demand traders: the significant time and effort required to find zones and qualify setups by manually going through hundreds of charts. And the countless opportunities missed when you simply couldn't cover as much ground as you would like.
It goes far beyond other supply/demand indicators which merely show zones on charts. It is also far more accurate, developed by a veteran supply/demand trader who has used the S/D methodology for 17 years and helped many other traders master it, including some who spent years and small fortunes trying to learn it elsewhere.
SD Zones is a serious trading tool used by a small group of serious traders and backed by serious performance stats.
It runs on the TradeStation platform. Traders on other platforms regularly open TradeStation accounts just to get access to this tool, even if they execute their trades elsewhere.
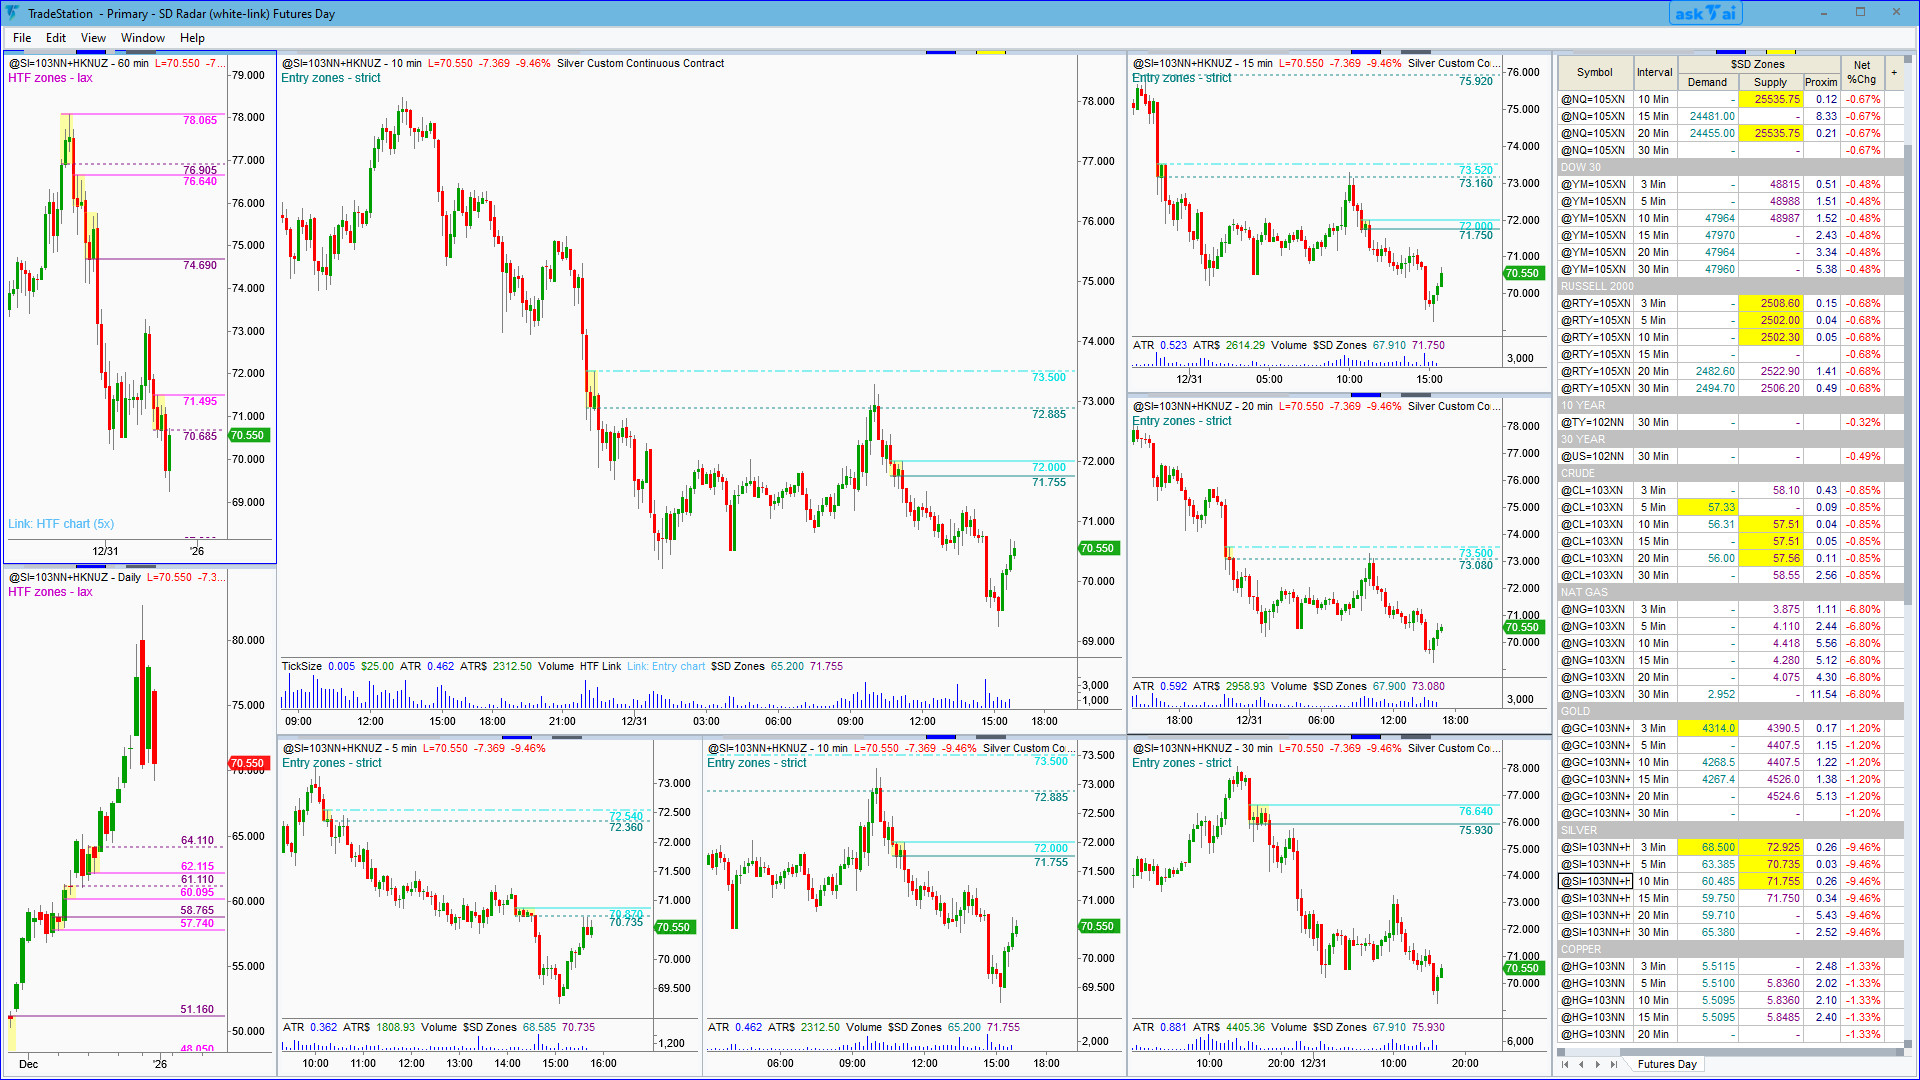
The SD Radar workspaces employ a "cockpit view" to quickly locate and qualify potential trade setups, with High Timeframe charts (left), Entry charts (center) and real-time scanning (right). Here the Futures Day workspace scanning for trades on 3-30 minute intervals in 18 different futures markets. All in real-time, notifying and alerting the trader where and when potential setups warrant their attention. Traders can add or remove symbols and timeframes they want to scan. Workspaces come in both black and white variants for different user preferences.
The underlying cause of support and resistance
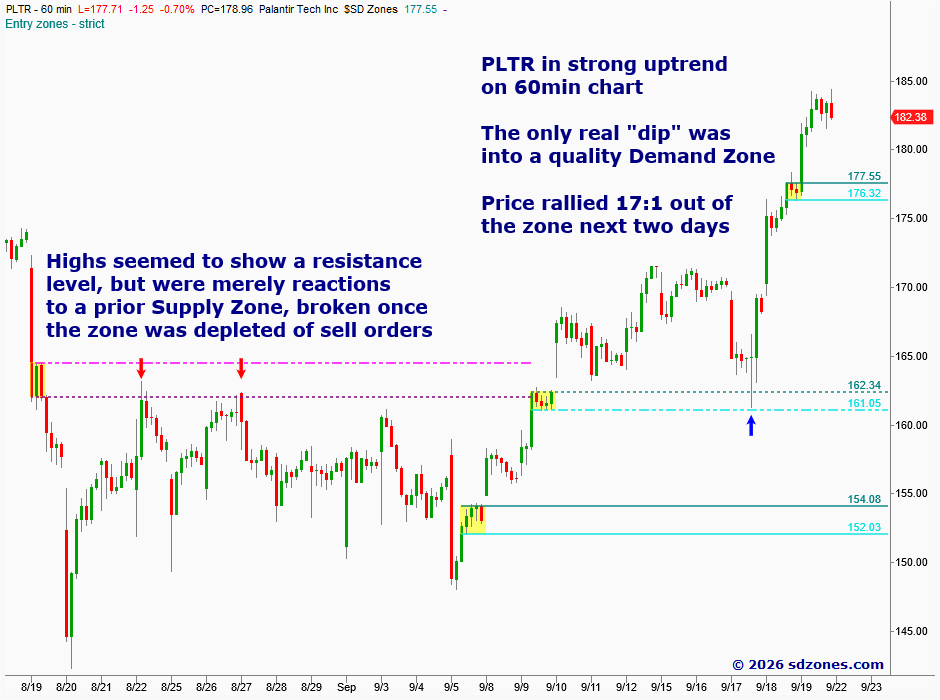
A variant of Wyckoff Ranges, supply and demand zones are as valid today as when they were discovered a century ago, because there is almost no way for institutions and other large players to avoid leaving these "footprints" signaling pockets of unfilled institutional orders.
That is why demand and supply zones are some of the most reliable forms of support and resistance ever. Most traditional support/resistance levels are merely reactions to prior demand and supply zones rather than levels in their own right.
With these zones on your charts, you will often see what really caused those apparent support and resistance levels and whether you can expect them to work again.
Spend your time smartly: qualifying, not digging
Instead of poring over hundreds of charts to look for zones, SD Zones monitors hundreds of symbols, potentially in multiple timeframes, and all in real-time. See at a glance which symbols are near quality zones and jump straight to those charts.
In addition to highlighting upcoming zones, it can fire audible alerts or text messages so you don't have to stare at the screen all day. It allows you to spend your screen time being a trader, not a digger, reviewing only a few realistic trade setups.
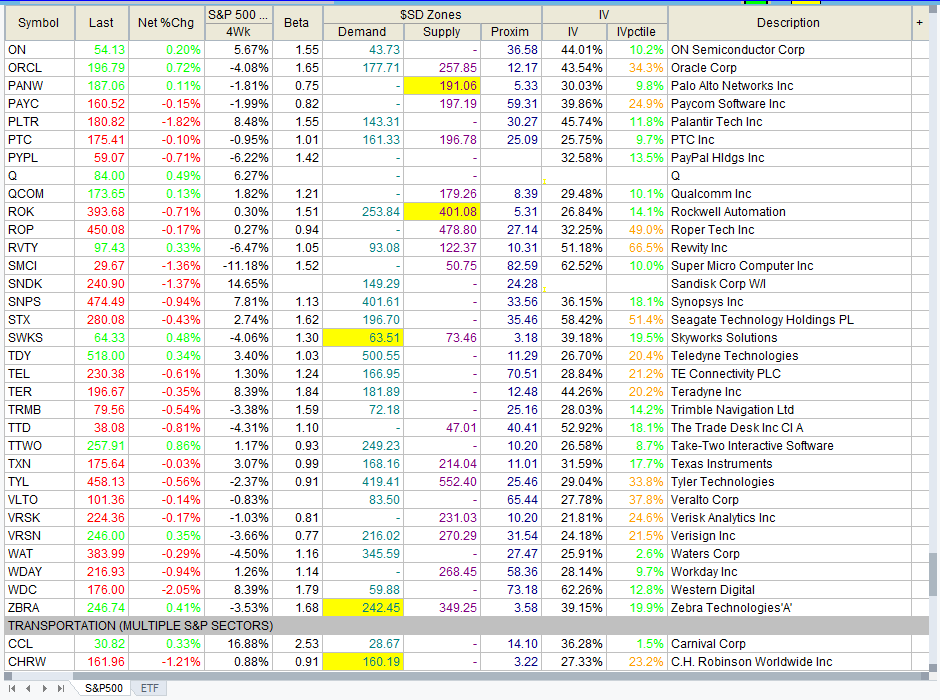
The Stocks Daily workspace lets traders quickly locate stocks or ETFs near quality zones and review at a glance whether they have the necessary characteristics to be considered for a stock or options trade, before even looking at charts.
Transparency: Revealing our hand
Performance stats going back 20 years
SD Zones is backed by extensive stats trading 1.2M+ zones in 18 futures markets and 7 ETFs going back 20 years. Its numbers are excellent. See the complete stats →
Small group of serious traders
We're a small group of traders, and that's how we like it. Most are retail, a few are fund managers and pros, but all are serious traders. Read what users are saying →
SD Zones Training Videos
Three hours of training videos for the latest release, covering the streamlined trade-finding workflow, minute and tick-based strategies, trade qualification lessons, performance stats and more. Watch on YouTube →
SD Zones User Guide
The complete 60-page manual covering introduction to the supply/demand methodology, Quick Start sections, the ready-to-use workspaces, full feature descriptions, supply/demand lessons and more. Download the PDF →