SD Zones: The better way to trade supply and demand zones
- High accuracy supply and demand zones indicator to find more and better trades, spending less screen time.
- Scans for zones across many symbols and timeframes and directs you to charts with upcoming zones, all in real-time.
- Fires alerts and text messages when a symbol approaches a zone or when new zones form, so you don't miss trades.
- Streamlines trade-finding and qualification, including preferred trade direction (trend) and room-to-go (profit potential).
- Works on stocks, ETFs, indexes, futures, forex and crypto symbols, in all timeframes.
- Proprietary zone detection engine: outperforms even many human supply/demand experts.
- Proven performance: measurements going back 20 years across 18 futures and 7 ETF markets.
- Excellent stats: 60–70% win rates (or higher) across 1.2M+ zones in Daily, Minutes and Tick timeframes.
- Mature platform: 9 years of active development, 50+ public releases since 2019, extensive training materials.
- Transparency: raw, unfiltered performance stats, testimonials, training videos and documentation.
SD Zones is a highly accurate indicator used to find Supply Zones and Demand Zones: chart patterns that indicate large pockets of unfilled institutional sell and buy orders at certain price levels. It shows the zones on charts, updated in real-time, and provides extensive options to configure zone criteria, time periods to scan and visual appearance.
But different from other supply/demand indicators, SD Zones not only shows zones on charts: it is a complete system that scans for zones across many symbols and timeframes, still in real-time, then directs you to charts with quality zones near current price. It then provides a streamlined workflow to qualify each zone as a potential trade setup — because contrary to what you may have heard, even great looking zones may not be high probability trade setups in the wrong context.
This qualification includes High Timeframe charts to gauge the preferred trade direction (trend) and room to go (profit potential), as well as neighboring chart intervals to verify internal zone structure.
This workflow allows traders to quickly review and qualify a few realistic trade setups, rather than wasting time poring over dozens or hundreds of charts to manually look for zones. Most supply/demand traders have been down that path.
For traders new to supply/demand, or who use other primary strategies, SD Zones is a perfect complement to other indicators and trade signals. It puts one of the most powerful and reliable forms of support and resistance on the chart, updated in real-time, helping traders focus on high probability trades and avoid low probability ones.
See benefits for traders below, performance stats, and testimonials from our users. Read why supply/demand zones are so reliable.
SD Zones works equally well on stocks, ETFs, indexes, futures, forex and crypto symbols, taking into consideration the variations in zone patterns on different timeframes.
It runs on the TradeStation platform. Traders on other platforms such as thinkorswim, TradingView, Interactive Brokers, NinjaTrader and MetaTrader regularly open TradeStation accounts just to get access to SD Zones, even if they trade their setups elsewhere.
To add the power of supply and demand zones to your arsenal, and the most comprehensive and statistically proven S/D software available, check how to get it. Or click the Get SD Zones button in the top-right corner.
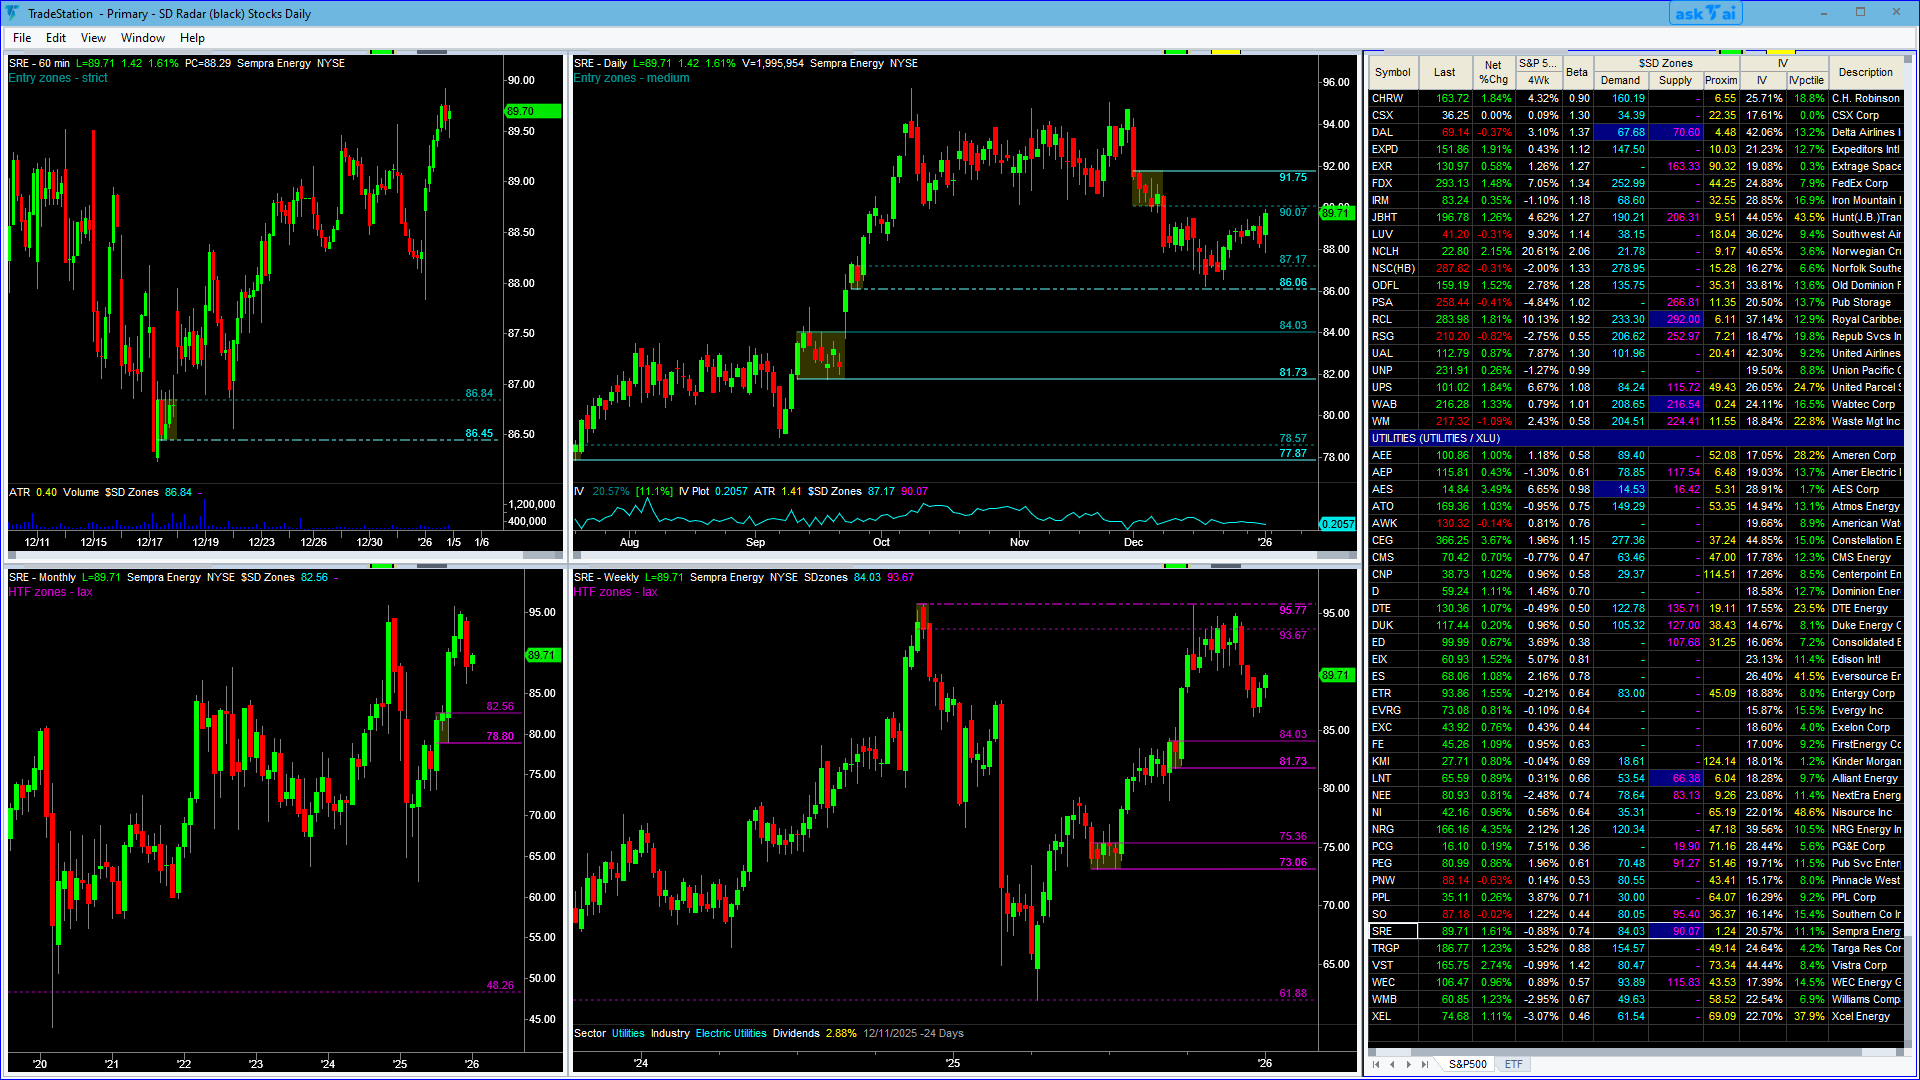
The SD Radar Stocks workspace scans the entire list of S&P 500 stocks and 80 ETFs. The RadarScreen (right) highlights stocks near quality zones and lets you quickly pass on stocks that do not have the desired qualities and go to the next candidate without even looking at charts. The Entry charts (top row) show the zone found in RadarScreen and an X-ray view to verify zone structure. The High Timeframe charts (bottom row) are used to determine preferred trade direction (trend) and room to go (profit potential). The workspace also shows Sector and Industry for proper correlation, IV, IV Percentile and Historical IV to evaluate options premium, and upcoming Dividends to avoid premature assignment and other gotchas.
SD Zones includes 20 workspaces for different styles of stock, options and futures trading. They come in both black and white variants for different user preferences. See one of the SD Radar Futures workspaces on our homepage.
Benefits for traders
SD Zones can be used by experienced supply/demand traders as well as traders who are new to the technique. Its benefits vary depending on each user's background and skill level:
Benefits for skilled supply/demand traders
- Scan for supply/demand zones across hundreds of stock, ETF, index, future, forex and crypto symbols of your choice, to quickly locate potential trade setups, without poring over dozens or hundreds of charts.
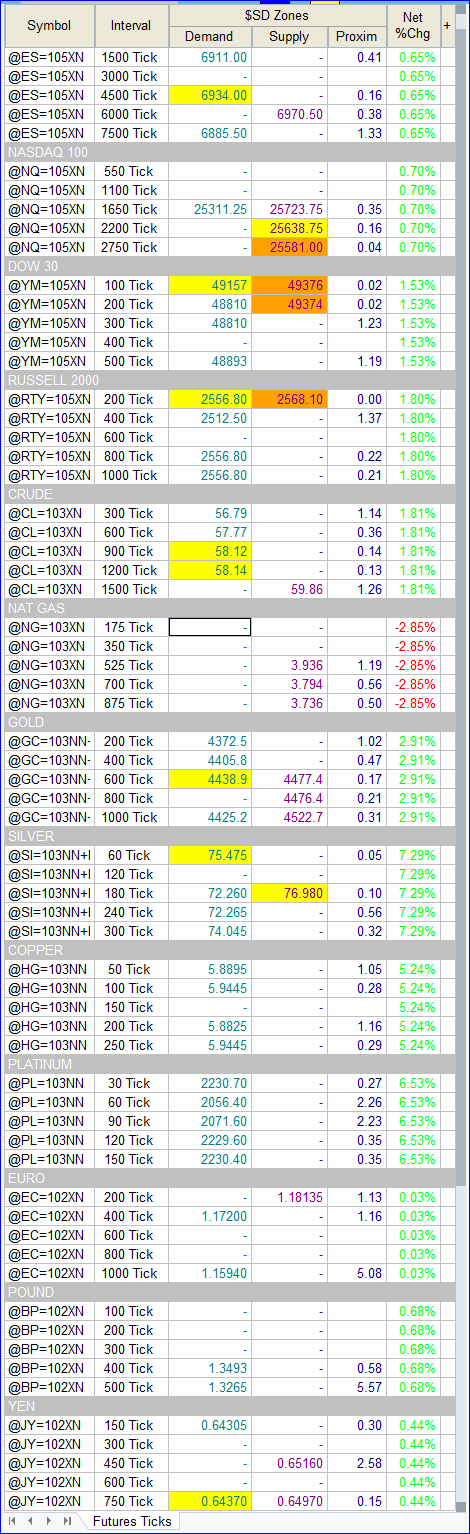
- Scan for zones on multiple intervals, in real-time, anytime, not just once a day like some trading services. Day trades, swing trades, position trades, on any timeframe and interval you want. You can even scan for tick-based zones instead of time-based ones (see screenshot).
- See at a glance which markets have potential trades coming up within a time threshold you specify: Day traders may only be interested in trades coming up in the next 20 minutes, swing traders in the next few hours, position traders in the next few days. We call it "proximity" to the nearest zone.
- Receive audible alerts or text messages when new zones form or when a symbol is near a zone, both of which you are likely to miss unless you happen to be looking at the exact right chart at the exact right time.
- Show zones on charts, not just as static lines, but updated in real-time as price touches into and depletes zones or breaks through them; or as new zones form. Zone lines reflect the "freshness" of zones: how depleted the order stack is.
- Instantly scroll the chart to the base of the zone to inspect it visually, even when it is months or years back in time.
- Improve your trading skills by spotting zones that would have been great trades, and easily review whether and how you could have caught them.
- Complete, ready-to-use workspaces to streamline trade-finding for Daytrading (3-30 min), Tick charts (intervals adapted to each market), Swing trading (15-240 min), XL Swing trading (60-480 min) or Position trading (Daily/Weekly) in futures, stocks and options. Add or remove any symbols and intervals you want. Workspaces are included in black and white variants for different preferences.
Benefits for traders NEW to supply/demand
- Automatically show supply and demand zones on your charts, to confirm other trade signals you already use for entries and exits; or to filter out other trade signals when they conflict with supply or demand zones.
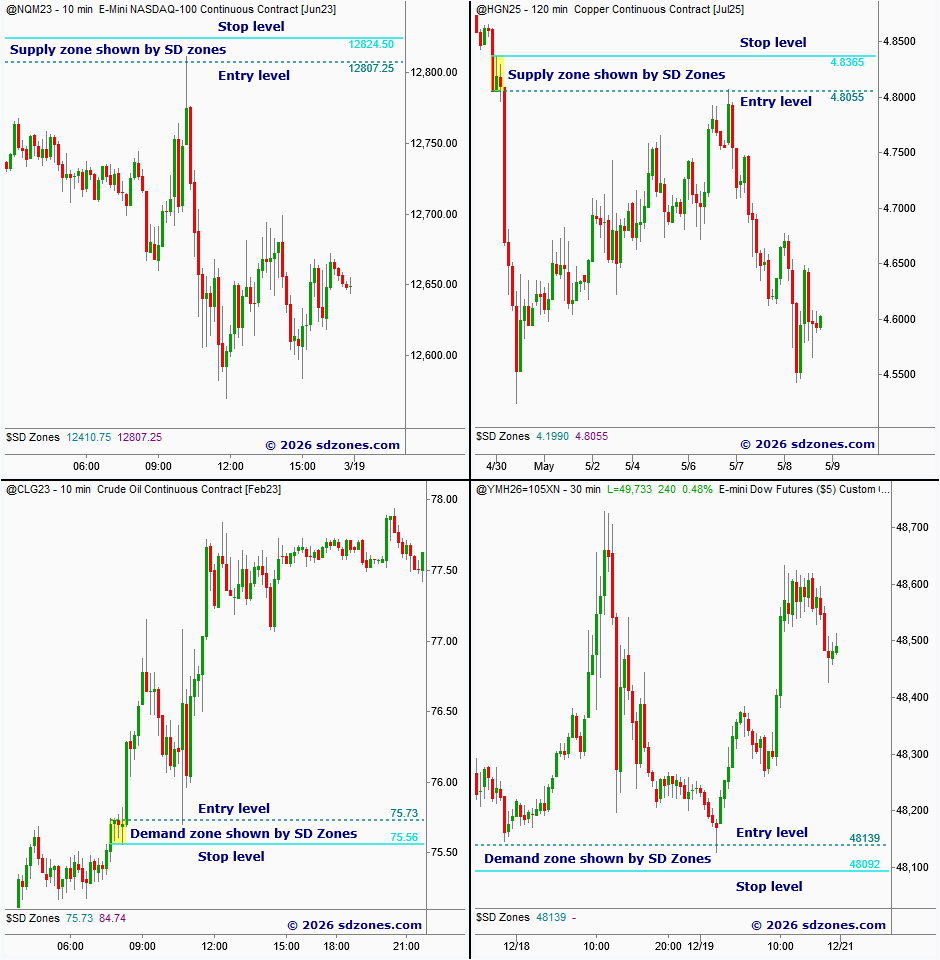
- Demand zones and supply zones are some of the highest probability support and resistance areas — which you would not otherwise notice unless you specifically look for them and your eyes are trained to spot them (see charts).
- Use zones to help improve your entries for higher probability and lower risk.
- Use zones to select target levels where price might turn or pause to maximize realistic profits on your trades.
- Use zones to select stop levels to ensure the smallest sensible risk that still keeps a high probability of avoiding stop-out.
- Use zones to spot what NOT to trade and filter out trades with low probability.
- Without knowing much else about supply/demand, these can boost your win rate and profitability considerably.
Benefits for ALL traders
- High probability zones, detected with proprietary detection engine, and backed by extensive performance stats going back 20 years.
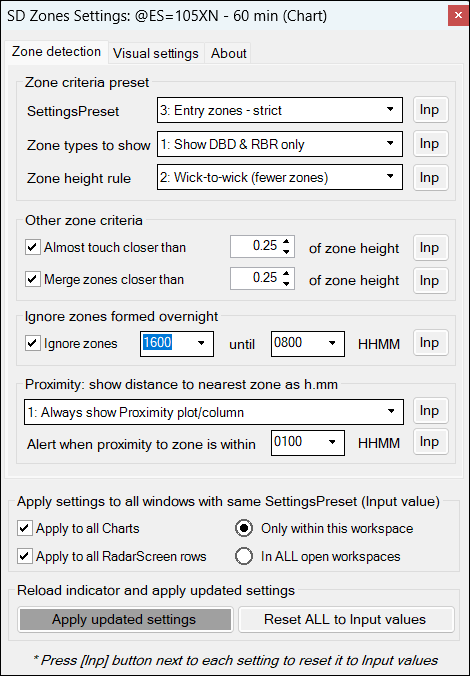
- Multiple different zone criteria presets with varying levels of "strictness" for Entry zones (used to select entry and stop levels) and High Timeframe zones (used to determine preferred trade direction and room to go). SD Zones even allows advanced traders to program their own custom zone criteria preset with 21 different parameters.
- Extensive customization options to fit your preferences for how to draw zones and how to show them visually on charts.
- Settings can be changed with traditional TradeStation Inputs as well as with an easy-to-use Settings panel (see screenshot), which allows changes to be applied to ALL charts and RadarScreen rows with a single mouse click.
- Pop-up menus to quickly toggle settings, manage alerts, and manually invalidate/restore zones.
- Additional indicators to help select and qualify options, stock and futures setups: IV, IV Percentile, Historical IV, Sector, Industry, Dividends, ATR, ATR$, TickSize and High Timeframe Link.
- Mature software with ongoing improvement and development: used by its developer since 2018 and by clients and subscribers since 2019. More than 50 releases and updates over 7 years.
- Extensive documentation, training videos, and education, including core supply/demand lessons.
Backed by extensive performance stats
SD Zones uses a proprietary detection engine to identify zones, which outperforms even many human supply/demand experts.
Based on thousands of hours of order flow and chart analysis, it goes deeper than commonly taught simple zone identification methods and indicators. Among other things, it incorporates aspects of Wyckoff analysis — the true foundation of the supply/demand methodology often overlooked by others.
Its performance is measured by trading ALL zones, without filtering, counting how many yield 1:1 profits or better before stopping out, with no stop management. Profit targets are relative to the height of each zone, with the addition of a small stop buffer.
While simple, this is not meant as a recommended trading strategy as it leaves profits beyond 1:1 on the table and doesn't adjust the stop to protect profits. Traders will generally outperform it by filtering zones for direction and location and use exit strategies to maximize their winners and minimize their losers. But sensible trade management should turn 1:1 moves into winning or breakeven trades. Hence, these stats reasonably count how many zones "work". And the raw stats are impressive.
SD Zones generally yields 60-70% win rates over the last 20 years in most common markets and timeframes (intervals), with some significantly exceeding this during various periods. Again, this is trading ALL zones without filtering.
The combined win rates from each of the most recent sets of performance measurements are shown below. Click the links to show the complete stats for each set, broken down by markets, intervals and periods:
- 71.56% of 145,368 zones across 7 different ETFs on 10, 15, 30, 60 minute and Daily intervals over 20 years to April 2025.
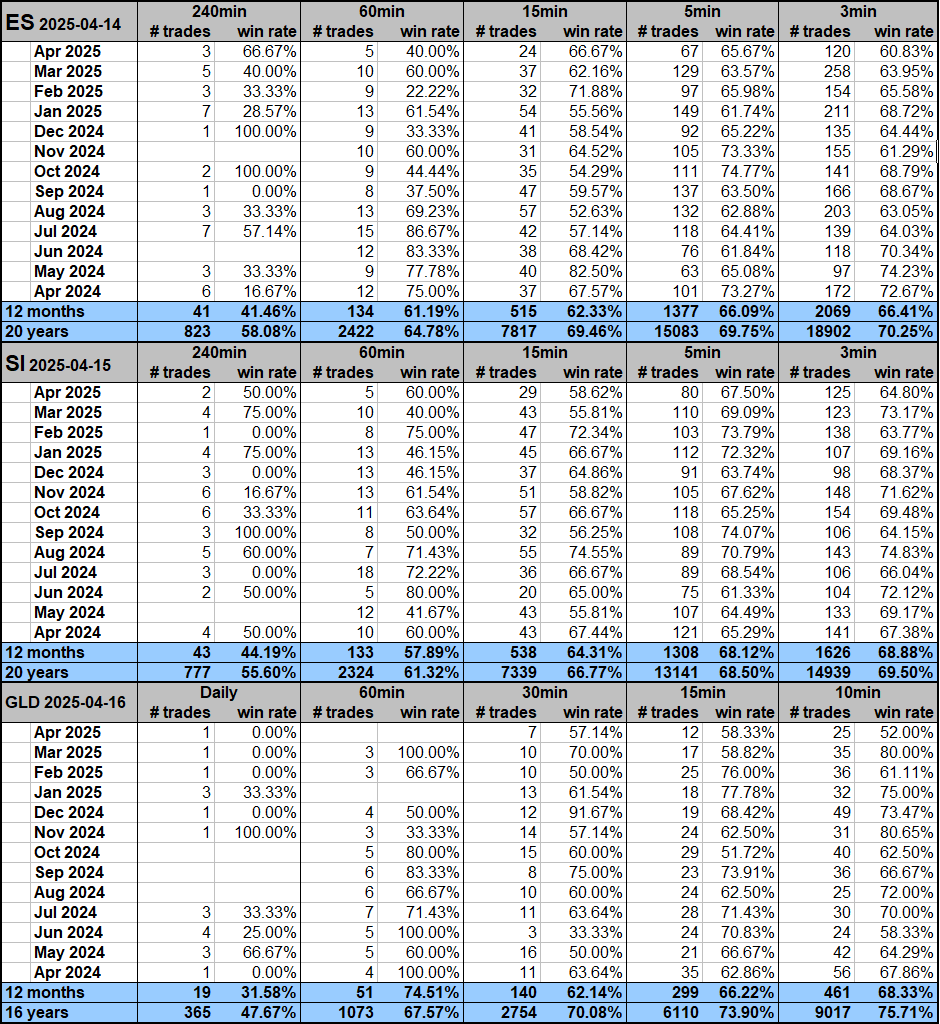
- 66.52% of 1,055,051 zones across 18 different futures markets on 3, 5, 10, 15, 60 and 240 minute intervals over 20 years to April 2025.
- 64.24% of 37,576 zones across 16 different futures markets on 5 different tick intervals (adapted to each market) over 6 months to November 2025 (Ticks preset).
- 62.90% of 61,782 zones across 16 different futures markets on 5 different tick intervals (adapted to each market) over 6 months to November 2025 (Strict preset).
These measurements are extremely time consuming to perform. Each set of tests is updated approximately every 12 months.
S&P 500 futures (ES), Silver futures (SI) and the GLD Gold ETF are historically some of the better-performing markets. But most markets regularly average 60-70% win rates, some even significantly higher, varying with timeframes (intervals) and periods.
What SD Zones is NOT
SD Zones is an immensely powerful tool for skilled supply/demand traders to find more trade opportunities while spending less time; and for ALL traders to improve their edge by adding one of the most reliable forms of support and resistance to their charts.
However, it is NOT an automatic "money printer" and wasn't meant to be.
It requires basic skill and discipline on the trader's part to qualify setups and trade them responsibly according to their risk tolerance, account size and individual rules.
It also requires traders to have enough "situational awareness" to recognize prevailing market conditions and step aside when they do not favor a given trade setup, whether because of its direction, location, time of day, market volatility or other factors which can greatly influence any trade, not just supply/demand trades.
What users are saying about SD Zones
"Thomas' Supply/Demand software is invaluable to me. I was looking for another trading strategy to incorporate into my trading. But since I trade while also holding down a full time job, I am not allowed a lot of time to scan for trade setups and charting. Fortunately for me Thomas' software enables me to incorporate supply/demand trading strategies into my trading day because it does most of the scanning and charting for me. I just have to do a quick review of the alerts that I have set up and then qualify the trade to decide if it meets my criteria or not. Honestly I would not be doing supply/demand trading without this software." – J.S.
"In 33 years of trading futures, stocks, options, and FX, I have to say that you have created the most accurate and indispensable tool I have come across. I started using your SD Zones indicator/methodology to trade futures intraday and a little over a year later it has become my core strategy for futures, stocks, and options for daytrading, swing trading, and even some long-term holds. The most recent update is absolutely invaluable for disambiguating and streamlining the identification of qualified setups. Specifically, the new tick-based workflow is a gamechanger that I adopted on day 1 of the update with consistent success ever since. Your meticulous and thoughtful attention to detail in the software, documentation, and training videos is greatly appreciated. But your genuine dedication to the success of your clients, as evidenced by your responsiveness and support, among other things, is a rare gem in the trading industry. You are truly one of a kind." – J.R.
"To Smart Traders. I'm here to mention that Thomas' method of finding actual, real time Supply and Demand zones is (in my opinion) the best tool I have seen for trading since my journey started around 10 years ago. The zones appear as they form, and it will save you a lot of time searching for QUALITY zones. With the adjustments he has included with the tool you can make them more strict or lax depending on your trading style. I believe you will be completely satisfied with the performance. Thank you." – B.L.
"The software is great for finding supply/demand zones for stocks and futures. The biggest benefit I receive is the RadarScreen which shows where the supply and demand zones are. I always look for the zones after the software gives me this information and it is a huge time saver. It is obvious Tom has put a lot of work into this product and it shows!" – D.C.
Transparency: Revealing our hand
SD Zones Training Videos
Three hours of training videos for the latest release, covering the streamlined trade-finding workflow, minute and tick-based strategies, trade qualification lessons, performance stats and more. Watch on YouTube →
SD Zones User Guide
The complete 60-page manual covering introduction to the supply/demand methodology, Quick Start sections, the ready-to-use workspaces, full feature descriptions, supply/demand lessons and more. Download the PDF →