Supply and demand zones introduction ‑ page 4 How to trade supply/demand: Why great zones fail
Page 1: What do you mean supply and demand
Page 2: Institutions vs retail: Wyckoff still works
Page 3: The 4 market stages: Inside the order flow
Page 4: How to trade S/D: Why great zones fail
Supply/demand zones as trading strategy
As should be clear by now, demand zones and supply zones are some of the most reliable forms of support and resistance in all of technical analysis. Thus, they can be used as confluence to strengthen almost any trading strategy and improve its win rate, profit factor, or both.
But supply/demand zones can also be used as a complete trading strategy on their own to locate trade setups with low risk, high reward and high probability. While there are different schools of supply/demand strategies, they all share some common principles:
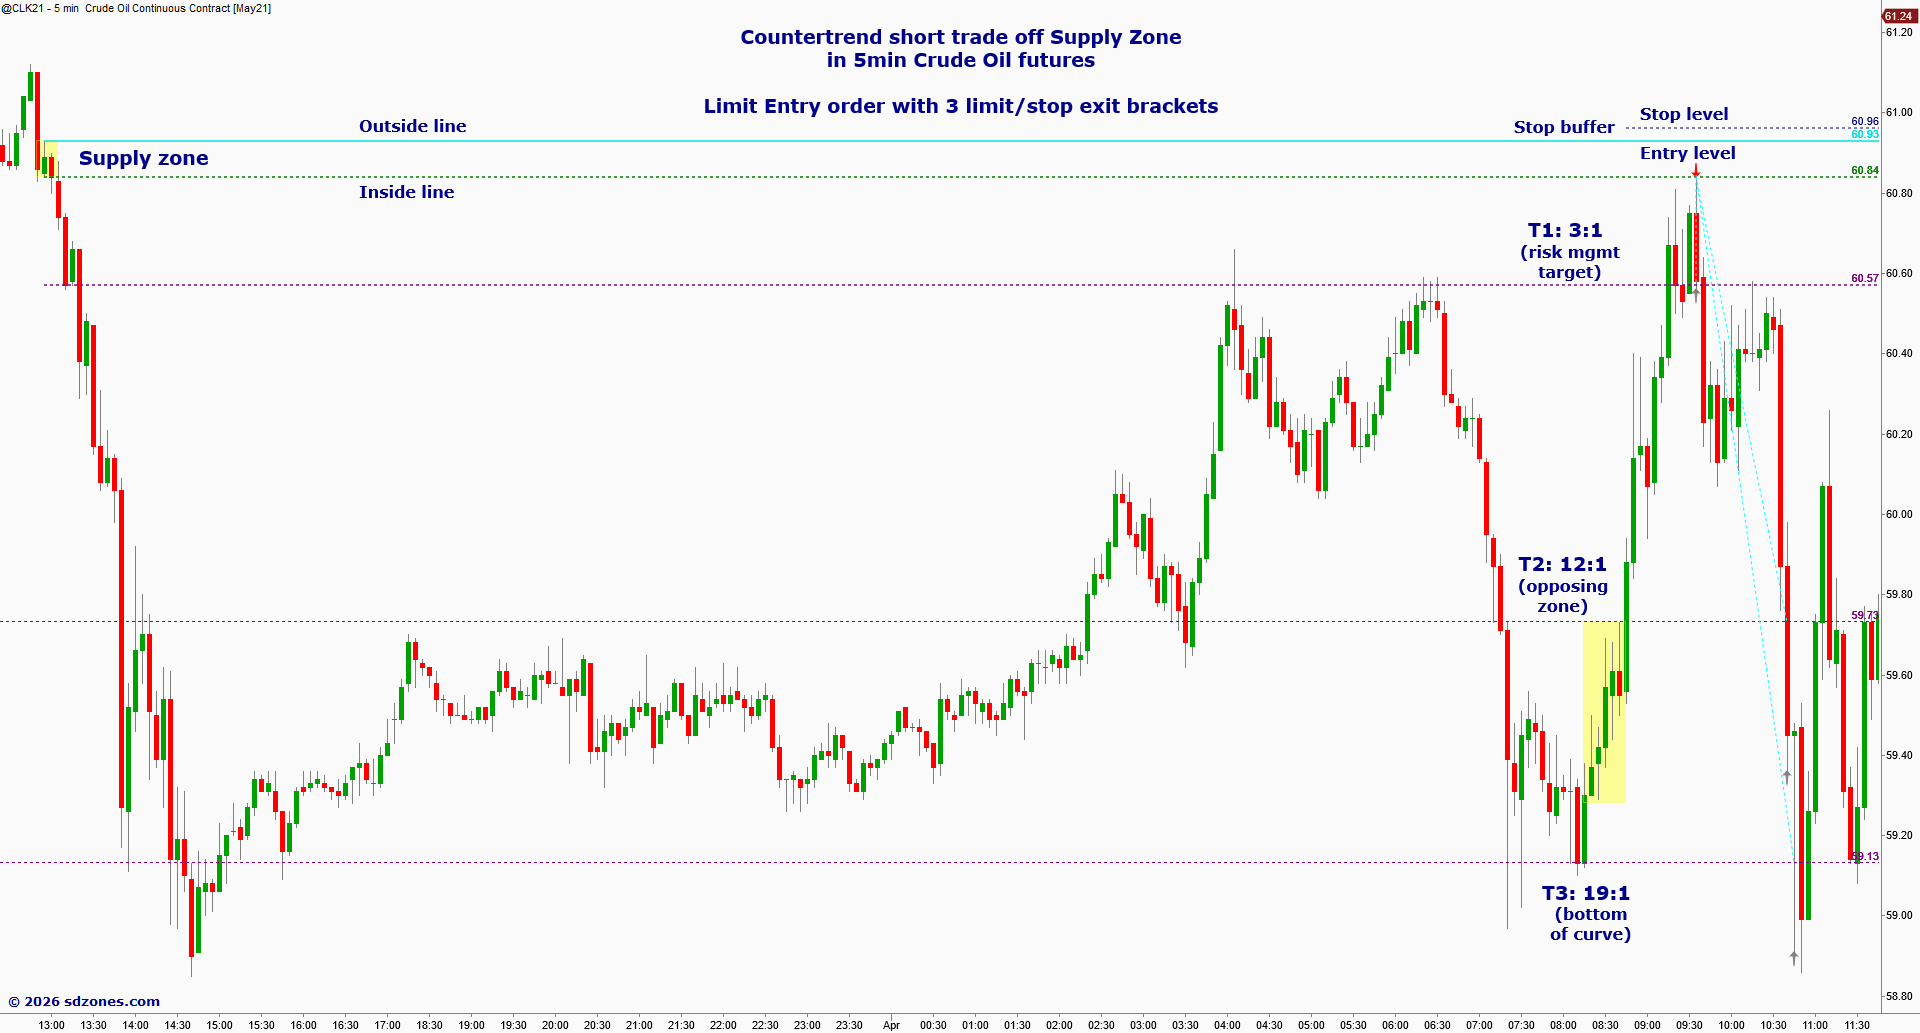
Skilled supply/demand traders will identify a "qualified" supply or demand Entry zone after it has formed, and wait for price to revisit the zone. They do not enter when price first breaks out from the zone.
When revisited, they will then enter a trade at the "inside" level of the zone — long at demand zones, short at supply zones — and expect price to reverse for a profitable trade. It often does, as evidenced by our SD Zones performance stats.
Not all supply/demand trades work out as perfectly as this example. But experienced supply/demand traders can testify that trades like this are fairly common, and can seem almost unreal to traders unfamiliar with the supply/demand technique. That said, some losing trades are unavoidable. That is true of any strategy, including supply/demand zones. But since most well qualified supply/demand setups offer a generous reward/risk ratio, traders can afford to have several losing trades and still remain quite profitable.
Depending on the quality of the setup, resting limit orders and exit brackets can be used for true set-and-forget trades; or various types of confirmation entries can be employed. On particularly good setups, traders may enter just before price reaches the zone to ensure they catch the move before price reverses.
The distance to "opposing zones" provides an excellent indication of profit potential for the trade, and such zones provide target levels where price may stall or even reverse.
The "outside" level of the zone — above a supply zone, below a demand zone — provides an ideal stop placement, as the pocket of institutional orders will be depleted if price breaks through the zone. Thus, it allows for the smallest sensible risk on each trade with the highest probability of avoiding stop-out.
This alone is an invaluable use of supply/demand zones that doesn't get nearly the fame it deserves because nobody wants to talk about losing trades, even though they are an inescapable part of trading. One of the greatest secrets to consistently profitable trading is to keep losers small, not try to avoid them altogether. And certainly not to pretend they don't exist. There is more to be learned from reviewing one's losers than one's winners. But that's a topic for another article.
To dodge market makers and other stop hunters, traders usually add a small stop buffer between the "outside" level of the zone and their actual stop order.
Supply/demand traders use countless variations on this general supply/demand strategy, including scaling in and out of the position, choosing targets to get the most out of each trade, managing their stops, and adjusting entry and stop levels according to zone quality.
There is also a plethora of special options strategies using supply/demand zones on the underlying. They are a match made in heaven when paired with skillful use of options theory.
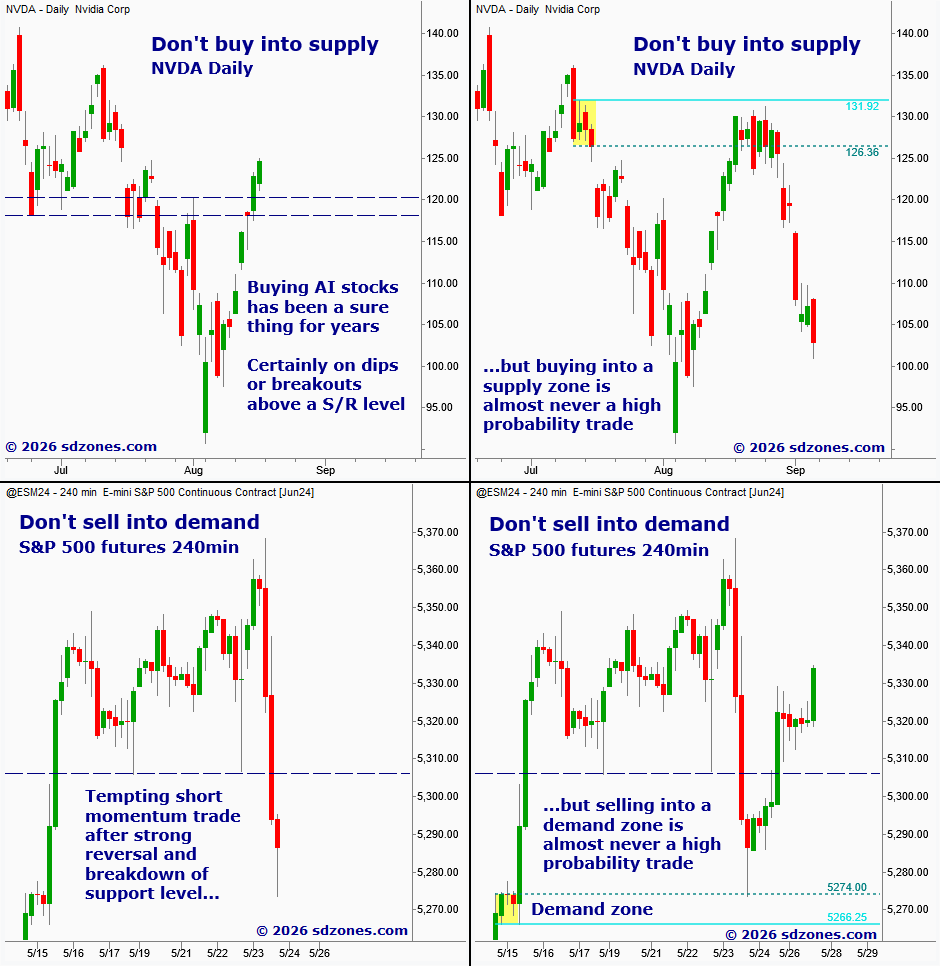
One of the most important uses of supply/demand zones is recognizing what NOT to trade, which can be summarized as don't buy into supply and don't sell into demand (see charts). Entering long just below a supply zone or short just above a demand zone is generally a bad idea since price is likely to grind its way slowly through the zone — if it doesn't reverse altogether. Are there exceptions? Sure, many. But generally better to simply stay on the right side of the zone.
Using supply/demand to get the Big Picture
Market mechanics do not exist in a vacuum, and neither do supply and demand zones. To repeat a crucial truth from the 4 market stages: even great zones can fail in the wrong direction, and even mediocre zones can work in the right direction.
Traders need to have situational awareness: the ability to recognize prevailing market conditions, and the discipline to step aside when they do not favor a given trade setup. The most skilled traders in the art of "reading the room" often have decades of experience.
What if you don't have that kind of experience?
Well, you are in luck.
As it turns out, applying supply/demand analysis to High Timeframe charts (HTF charts) is one of the most reliable ways to determine a "preferred trade direction"; far more reliable than old-fashioned trend analysis (Higher Lows with Higher Highs for uptrend, vice versa for downtrend) which often only signals a trend when it is almost over.
On the subject of "almost over", applying supply/demand analysis to HTF charts is also one of the most reliable methods to determine how much further a trend is likely to continue, or what we call room to go: spotting when probability no longer favors continuing trades in the current trend direction. Again, far more reliable than other forms of direction or trend analysis.
In fact, supply/demand zones on HTF charts are so powerful and so reliable that many traders use them as their primary trend analysis technique even when trading other strategies than supply/demand zones. It is one of the most powerful techniques in all of technical analysis. And not very broadly known.
HTF charts are generally 5-10X the interval (timeframe) of Entry charts, and use "lax" criteria to identify zones. HTF zones are not traded directly, but merely used to establish preferred trade direction and room to go for any setups on the Entry chart. Again, even other entry setups than supply/demand.
SD Zones contains different zone criteria presets for Entry zones and HTF zones, and includes workspaces that streamline the HTF evaluation process.
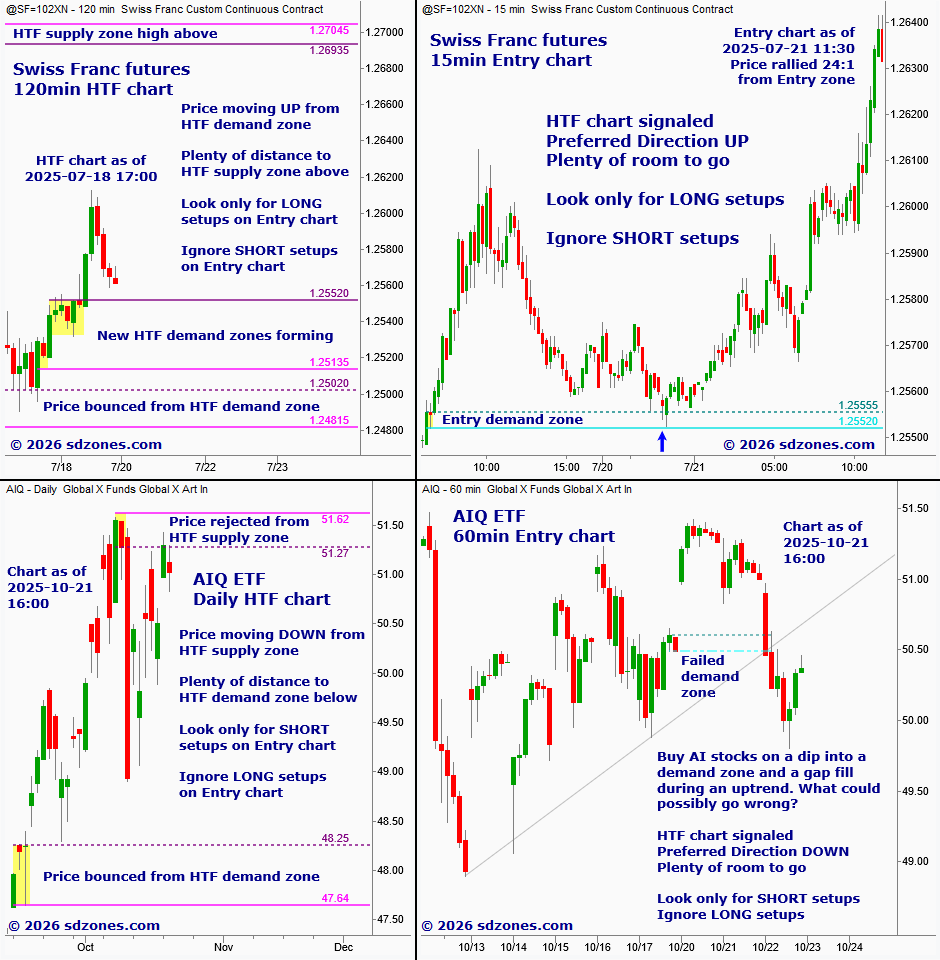
High Timeframe charts (HTF charts) are used to evaluate the Big Picture and to qualify — or disqualify — setups on Entry charts.
The top-left HTF chart shows the picture we want to see for a LONG setup. The top-right Entry chart shows the setup — and its outcome.
The bottom-left HTF chart shows the picture we DON'T want to see for a long setup. In fact, it's the picture we want to see for a SHORT setup. The bottom-right Entry chart shows the setup — which otherwise might look tempting — and its outcome.
Needless to say, there are many more pictures we DON'T want to see and just a few we DO want to see. So just look for the right pictures and ignore all the other ones and your trading should be a lot smoother.
We discuss this extensively in our training videos, the SD Zones User Guide, and our ongoing articles for traders.
The best supply/demand traders are ones who know how to use HTF zones to filter out low-probability trade setups even when the Entry zones themselves may look enticing; and who recognize excellent HTF charts, with a clear directional signal and lots of profit potential.
If you made it this far, we are impressed and you should be proud. You only have one more page to go, where we sum it up.